160+ Social Media Statistics Marketers Need in 2023

Looking for the latest and best social media statistics for 2023? We’ve compiled the most valuable insights for each platform so you can get an idea of which channel or trends to focus on this year.
Use this social media data on audience demographics, usage, and behavior to inform your marketing and social media strategy for the year ahead.
Note on sources: We have compiled these social media statistics from third-party surveys, white papers, and reports from the platforms themselves. Want to dig deeper? Get started with the Hootsuite Global State of Digital 2022 report.
Social media usage statistics
- Over 4.74 billion people around the world use social media.
- In 2022, the number of social media users increased by 4.2%.
- More than 75% of the world’s population aged 13 and older use social media.
- Over 93% of internet users are social media users.
- 76% of North Americans use social media.

Source: Hootsuite 2022 Digital Trends Report
- Globally, people spend an average of 2 hours 28 minutes a day on social media.
- In 2022, users increased their time spent on social media by 1 minute compared to 2021.
- Nigeria, Brazil and South Africa spend the most time on social media.
- Japan, South Korea and Austria spend the least amount of time on social media.
- In the US, time spent on social media is slightly below the global average, averaging 2 hours 11 minutes per day.
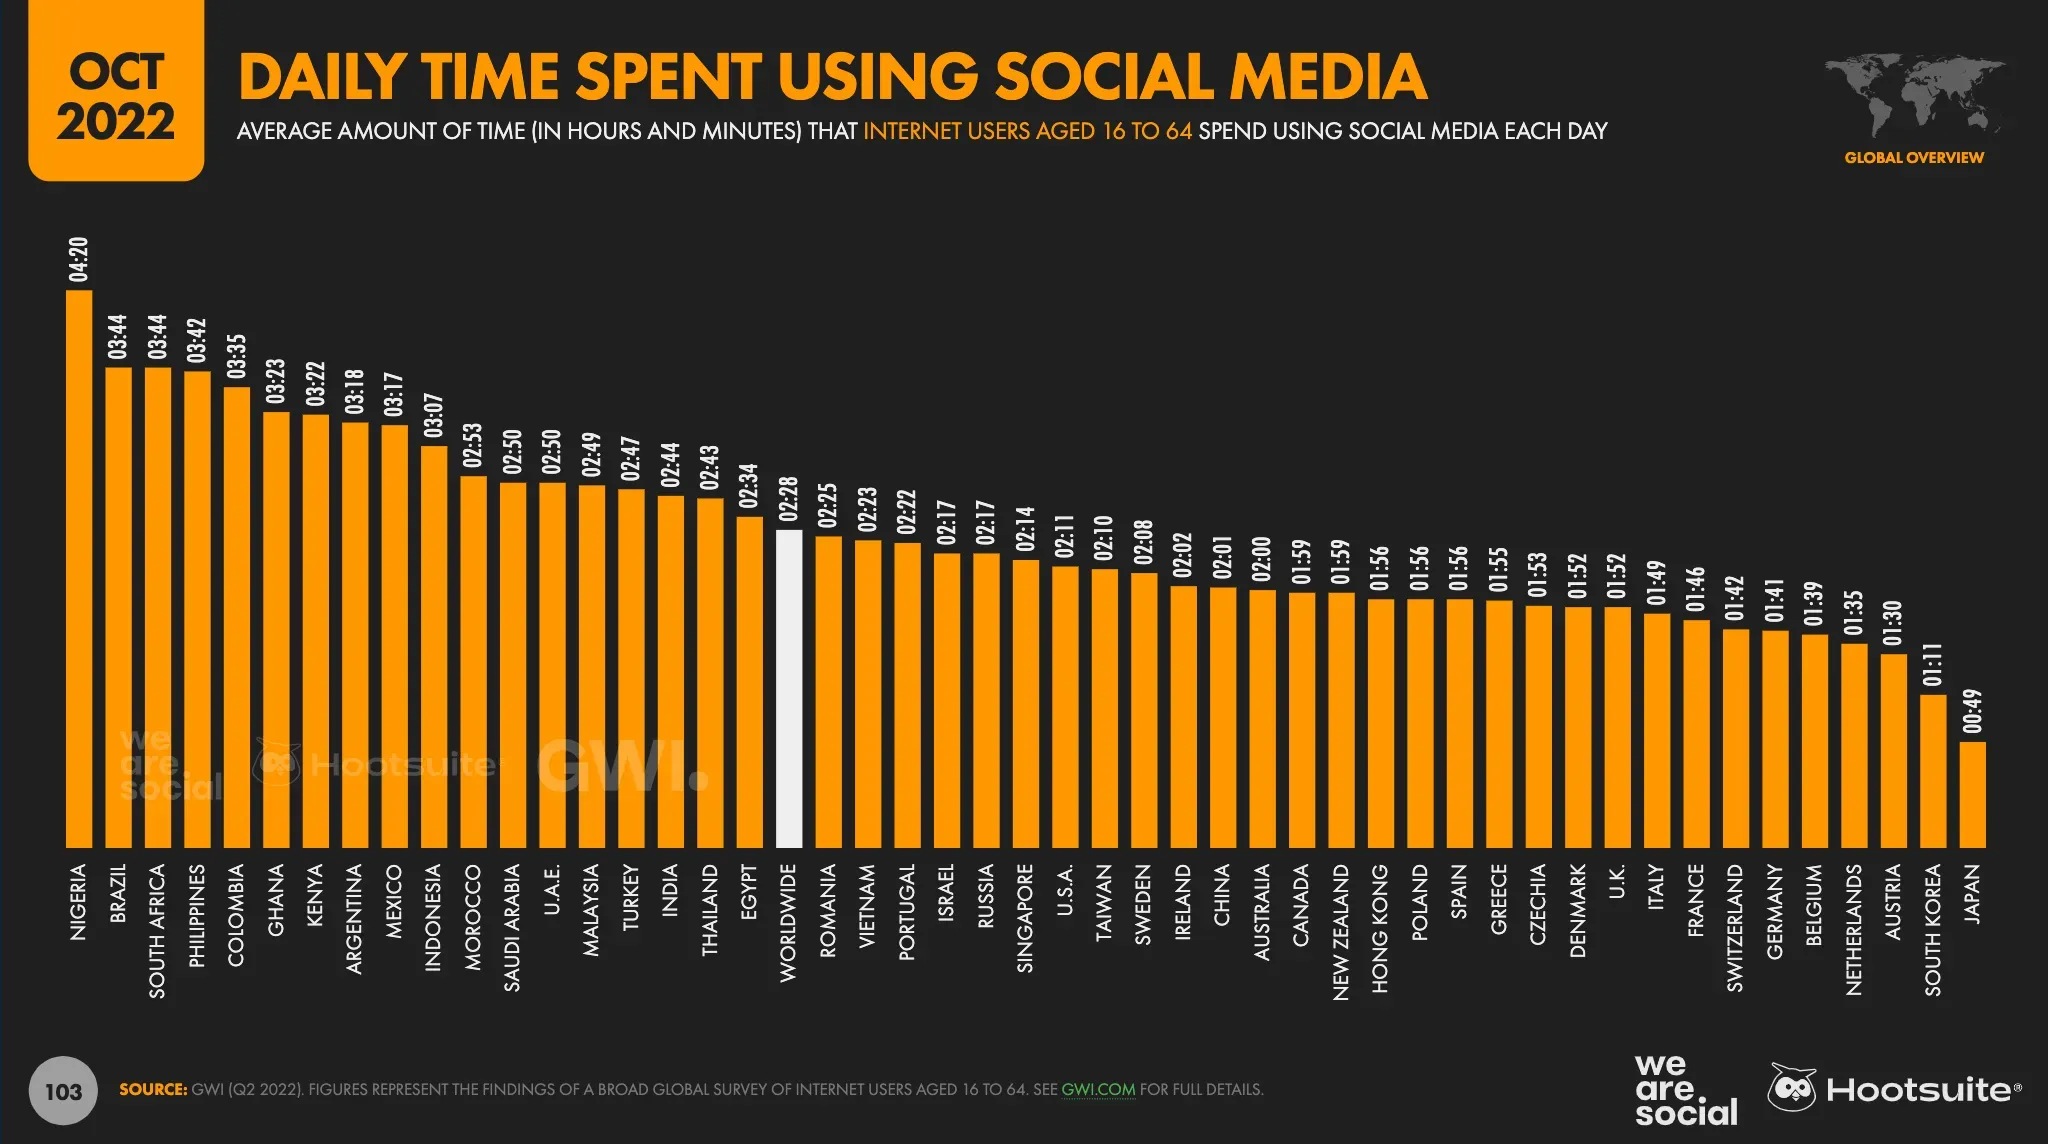
Source: Hootsuite 2022 Digital Trends Report
- The average user visits 7.2 social media platforms every month.
- Men aged 55-64 are the demographic that use social media the least.
- Women aged 16-24 use social media the most, spending an average of 3 hours and 10 minutes a day on it.
- The main reasons people use social media are to keep in touch with friends and family, fill their free time, and read the news.

Source: Hootsuite 2022 Digital Trends Report
Social media advertising statistics
- In 2023, social media advertising spending is projected to exceed $268 billion.
- In 2022, marketers spent $65.31 billion on social media advertising.
- Social video advertising is expected to reach $79.28 billion in 2024.
- In the third quarter of 2022, social spending increased by 12% compared to the third quarter of 2021.
- Overall user trust in social media platforms declined in 2022
Want to dive deeper into social advertising? Learn more about important social media advertising statistics.
instagram stats
Users
- Instagram now boasts over 1 billion monthly active users
- Instagram Ads Reach Nearly 30% of Internet Users
- Instagram is the fourth most popular social network in the world
- The average user worldwide spends 11.7 hours a month on Instagram.
Demography
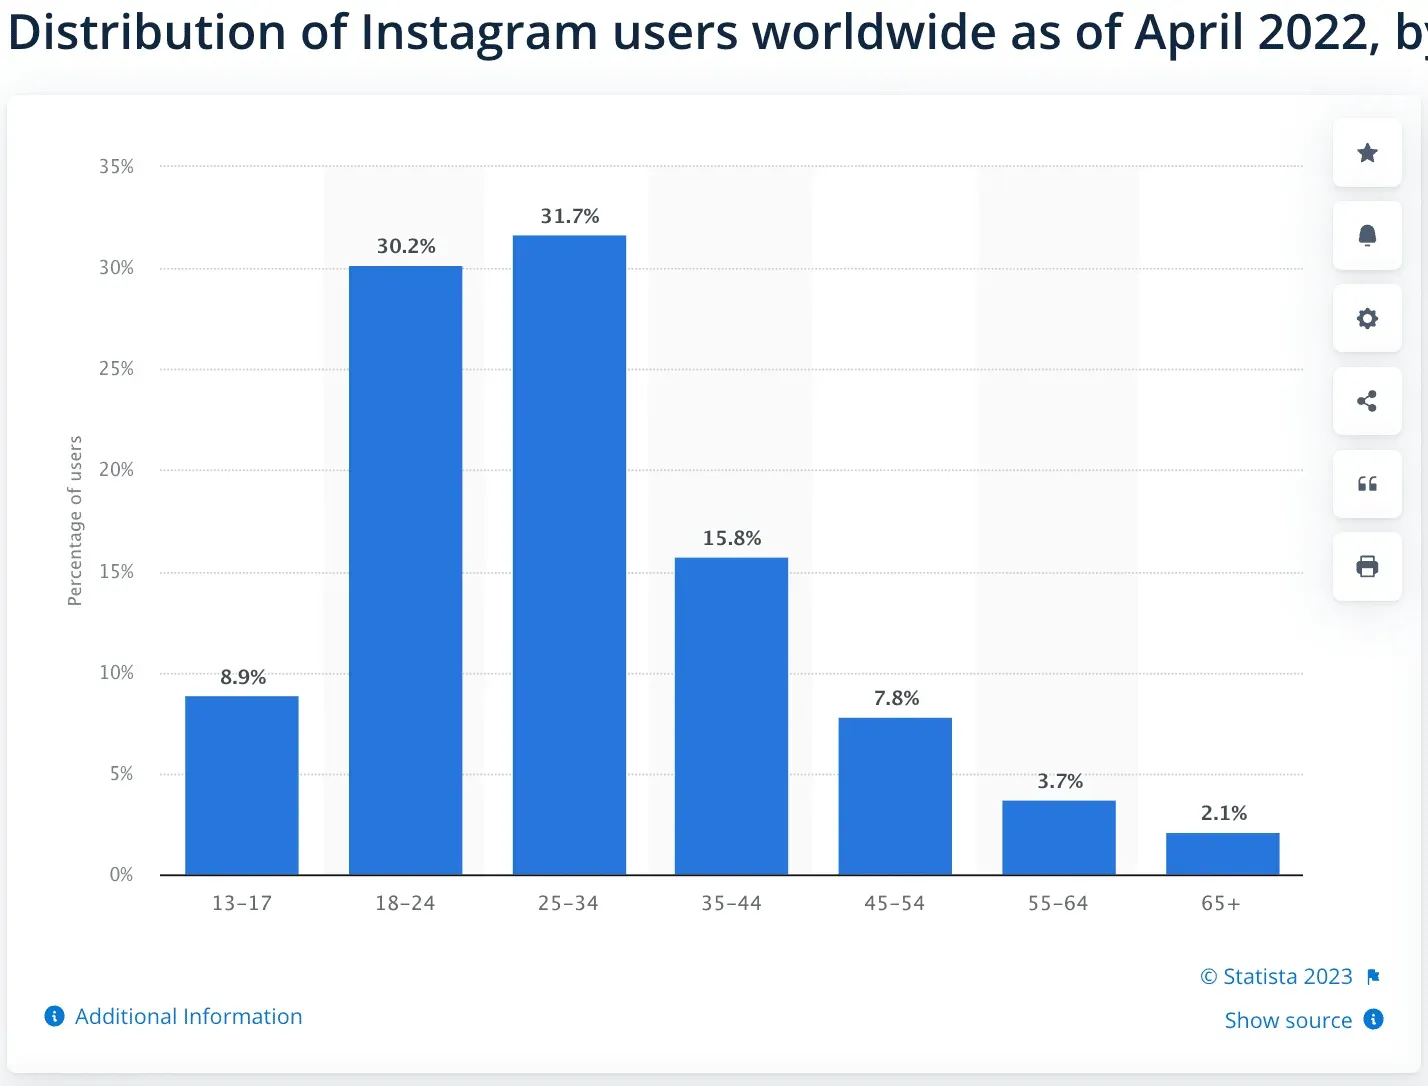
Source: Statistics
- Users between the ages of 25 and 34 make up the largest group of Instagram users.
- Around the world, Instagram is Gen Z’s favorite social network.
- Men make up 50.7% of Instagram users, while women make up the other 49.3%.
Application
- 59% of American adults use Instagram daily
- 91% of active Instagram users say they watch weekly videos on the platform
- 50% of Instagram users say they visited a brand’s website after viewing their Stories.
- More than half of Instagram users interact with a video at least once a week.
- Videos make up more than half of the content shared through Instagram private messages.
- Instagram ads are most likely to reach men and women between the ages of 18 and 34.

Source: Hootsuite 2022 Digital Trends Report
Brands
- 90% of Instagram users follow a business
- 62.3% of Instagram users worldwide say they use the platform to follow or research brands and products.
- 70% of users are willing to see ads when watching a video on Instagram.
Looking for even more Instagram marketing statistics? Take a look at 35 Instagram stats that matter to marketers in 2023.
Facebook statistics
Users
- Facebook boasts 2.93 billion monthly active users (MAUs), which is 36.7% of the total world population.
- 57.8% of the total number of Internet users in the world use Facebook monthly.
- Just over 67% of Facebook users visit the site daily.
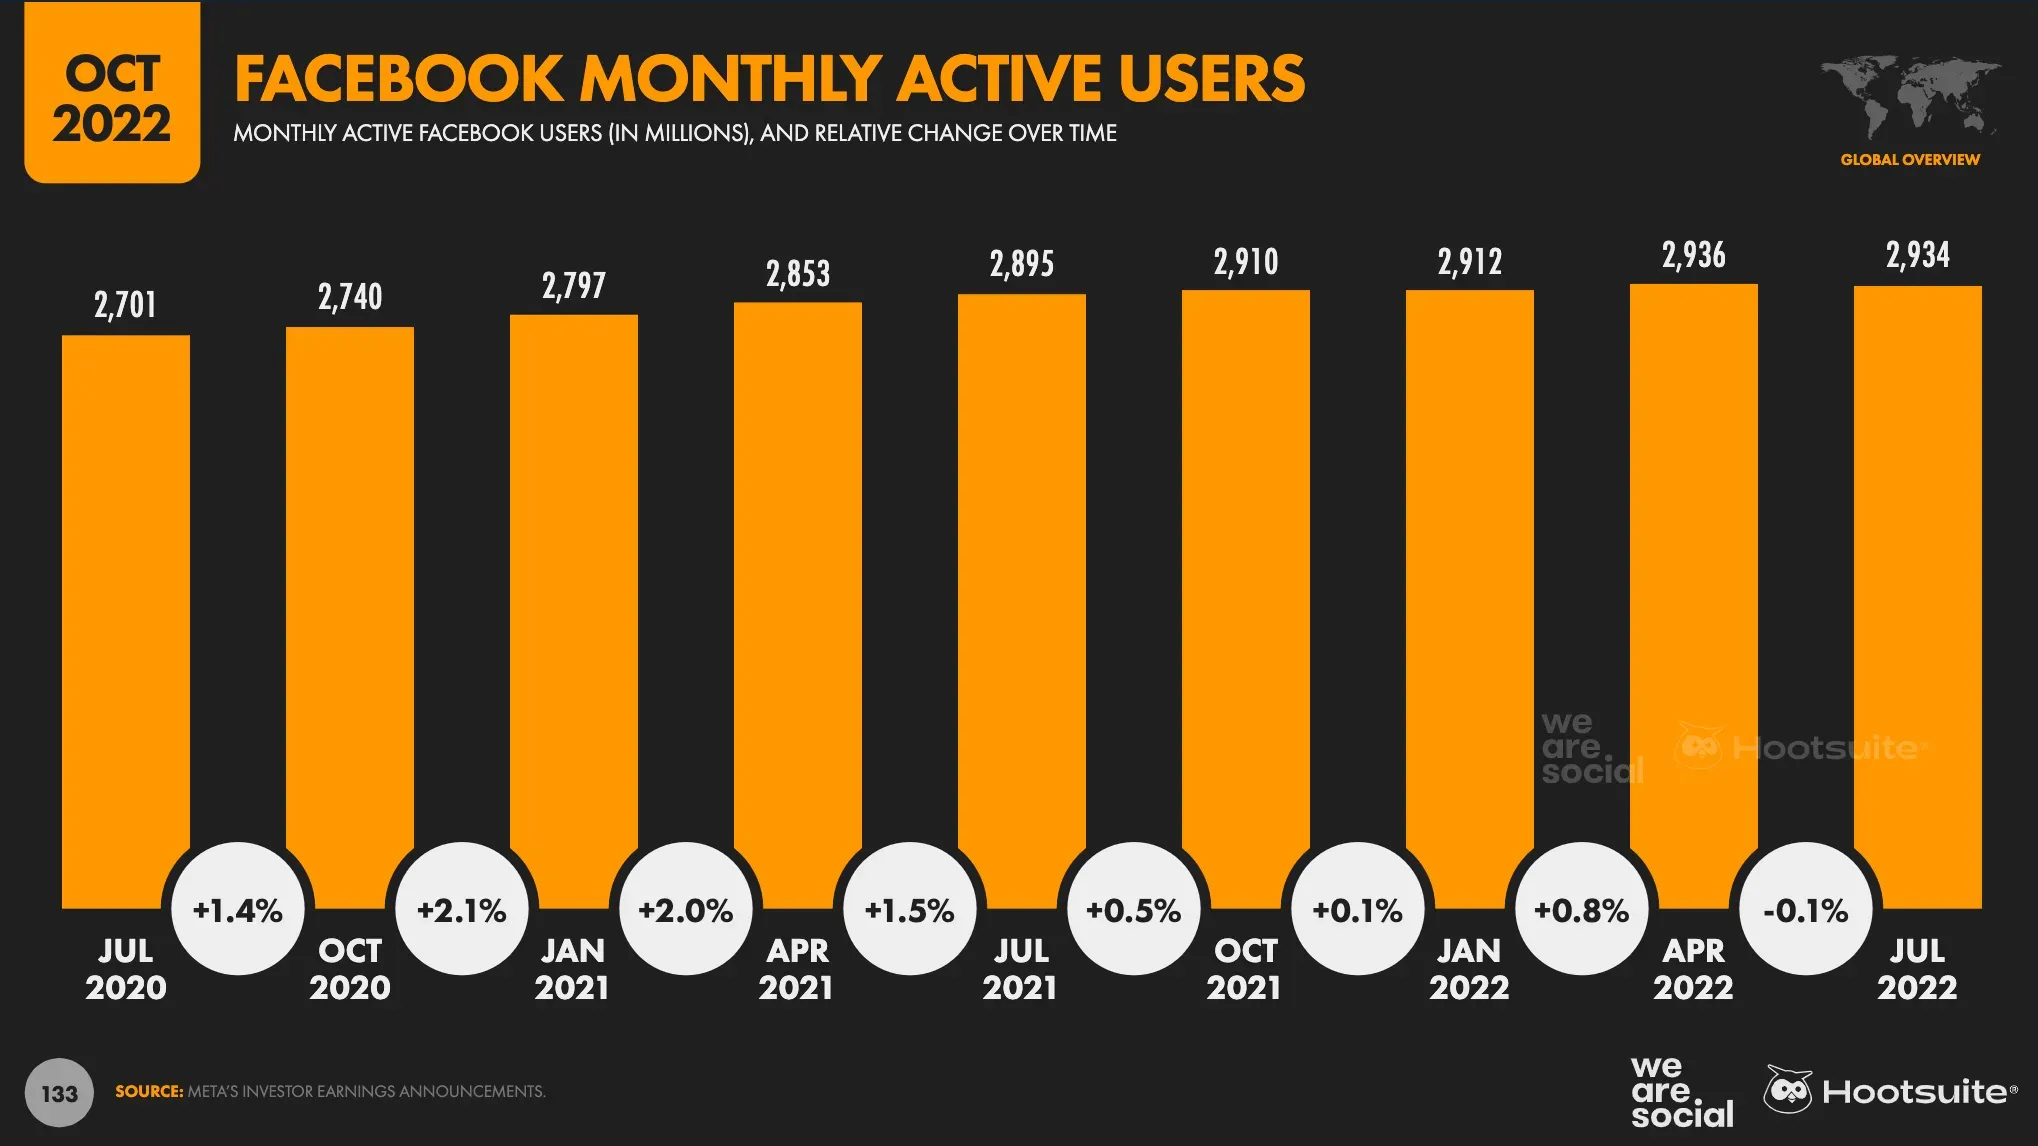
Source: Hootsuite 2022 Digital Trends Report
Demography
- 56.6% of Facebook users worldwide are men, 43.4% are women.
- Nearly 20% of Facebook users worldwide are men aged 25 to 34.
- Women aged 13-17 are the lowest demographic of Facebook users worldwide.
- In the US, people aged 25-34 use Facebook more than any other age group.
- Users aged 13-17 make up just 3.9% of Facebook users in the US.
- India boasts the largest Facebook audience with 327 million users. The US lags behind with 179 million users.
Application
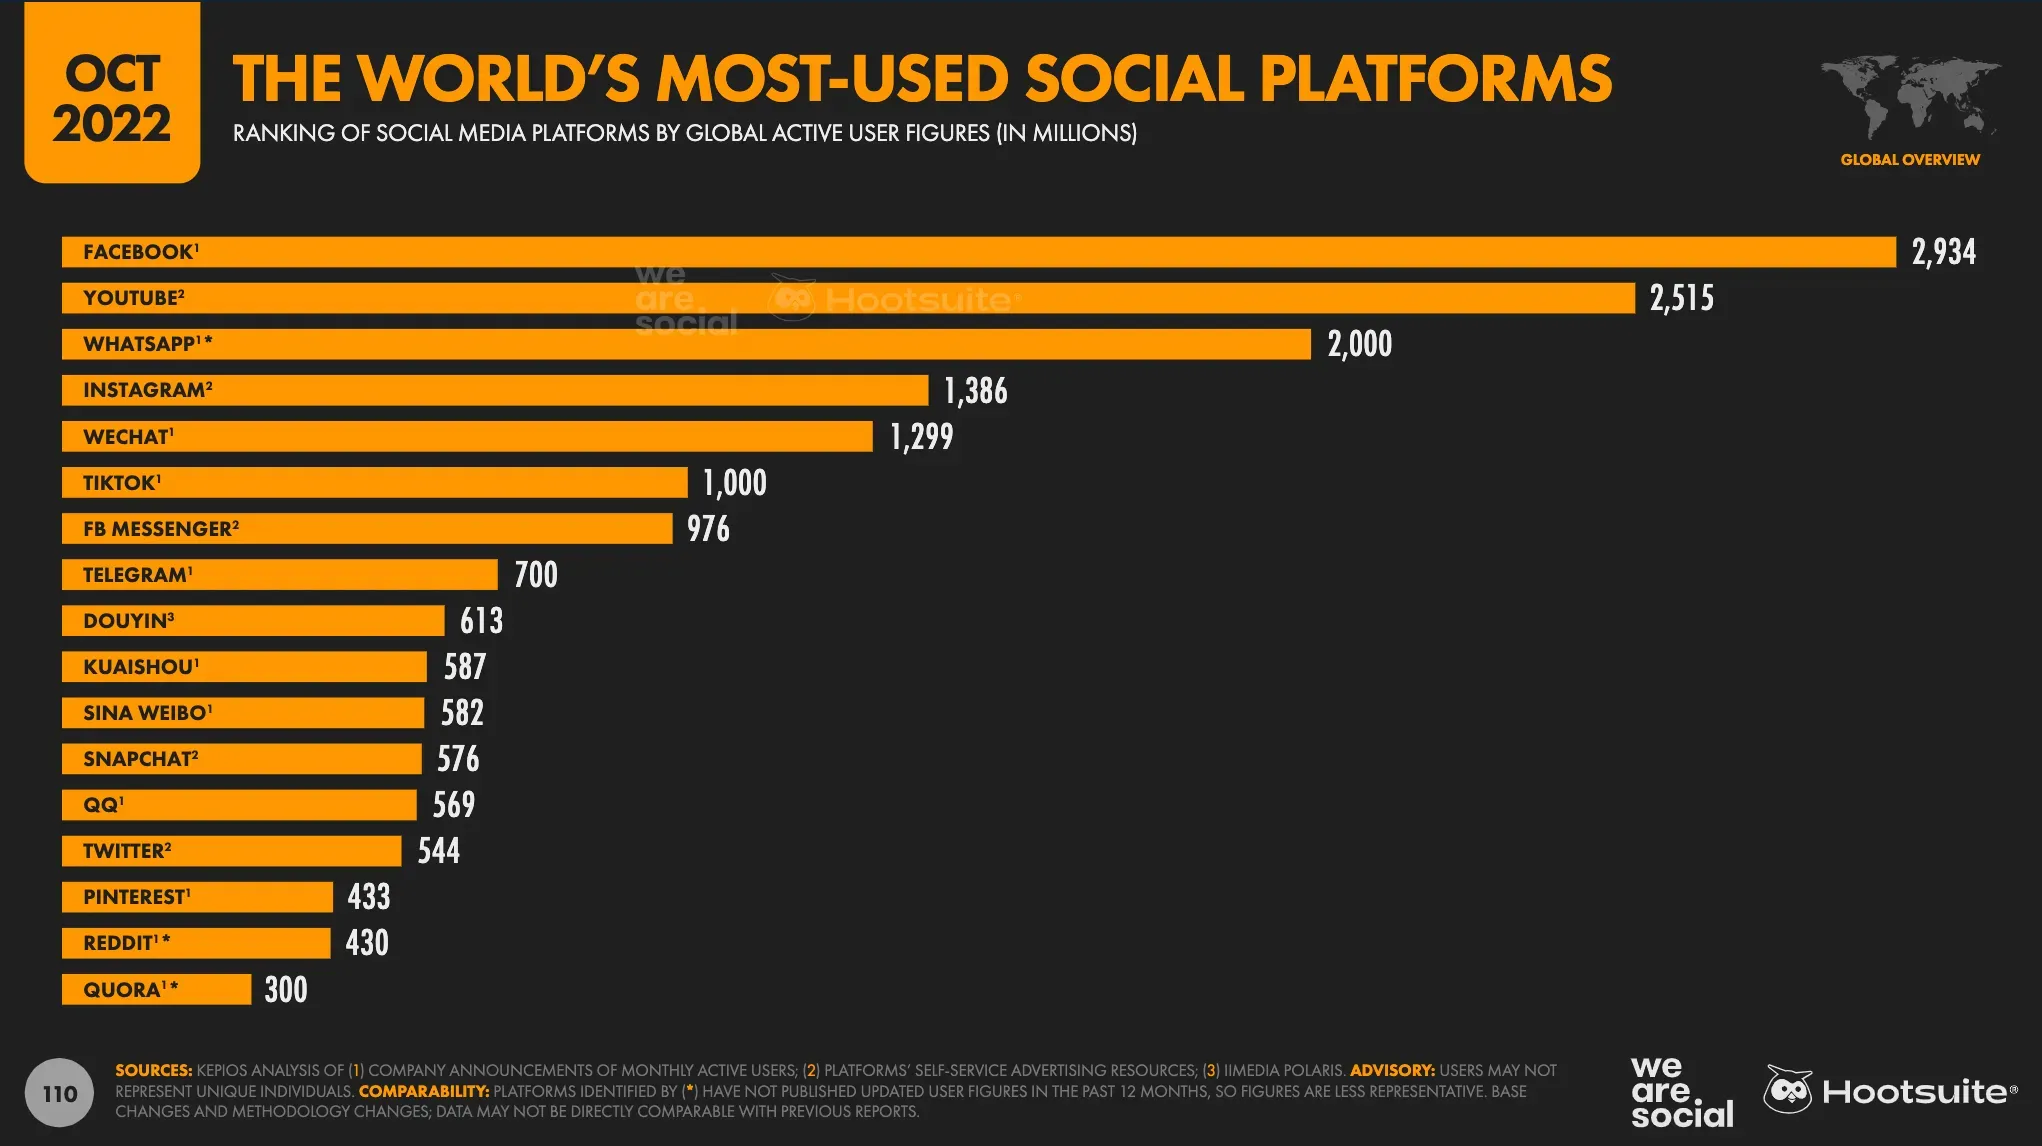
Source: Hootsuite 2022 Digital Trends Report
- Facebook is the most popular social network in the world
- People around the world spend an average of 19.7 hours a month on Facebook.
- Facebook is the second most popular social network after WhatsApp.
- Only 0.6% of users are unique to this platform, which means that Facebook is the only social platform this group uses.
- The main reason people use Facebook is to message friends and family.
- Over 77% of Facebook users also use Instagram
- The average US user spends 33 minutes a day on Facebook.
- More than a third of US adults regularly receive news from Facebook
Brands
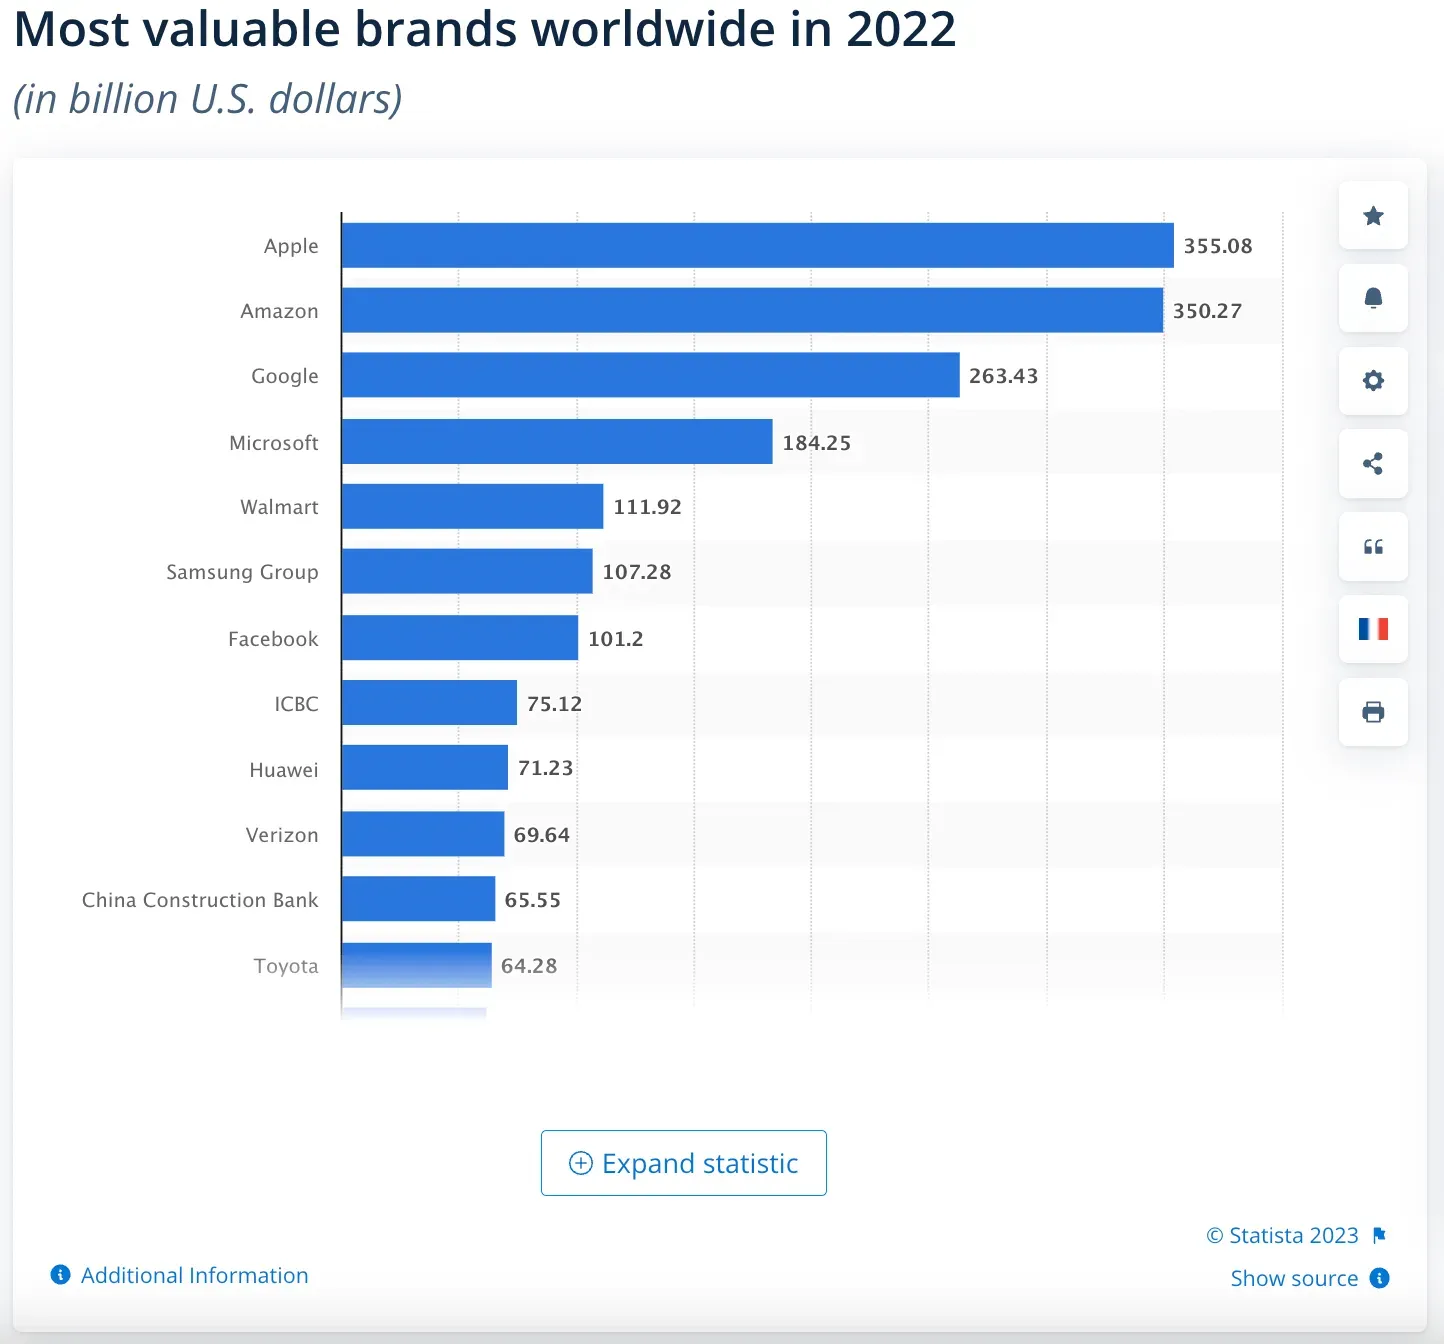
- Facebook is the seventh most valuable brand in the world
Source: Statistics
- 66% of Facebook users visit a local business page at least once a week.
- 69% of online shoppers using metaplatforms on a weekly basis made a purchase after viewing personalized content on Facebook or Instagram.
If you want to get ahead of the game in social commerce, check out our Social Commerce Getting Started Guide or other Facebook statistics.
TikTok statistics
Users
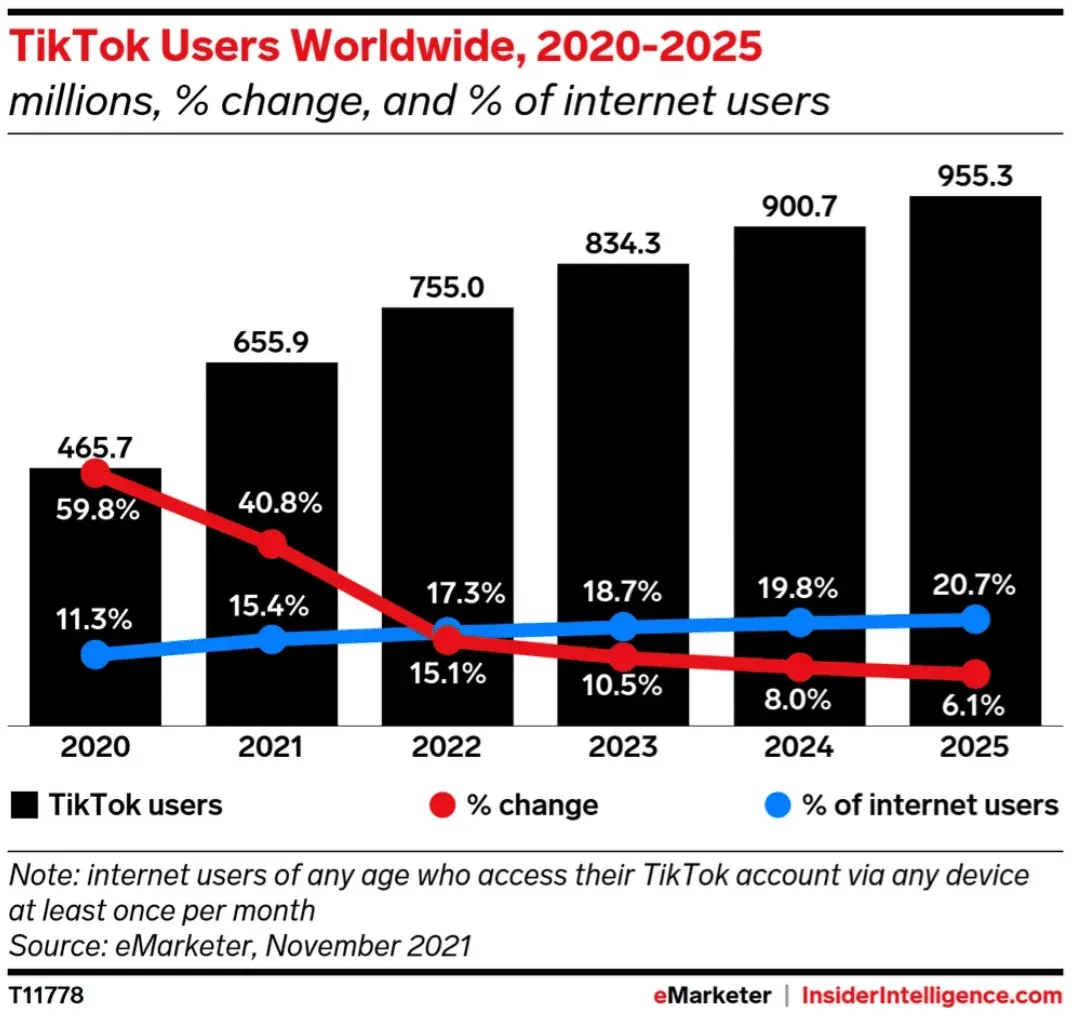
- TikTok reached 755 million users worldwide in 2022
Source: Insider Intelligence.
- 21% of American adults use TikTok
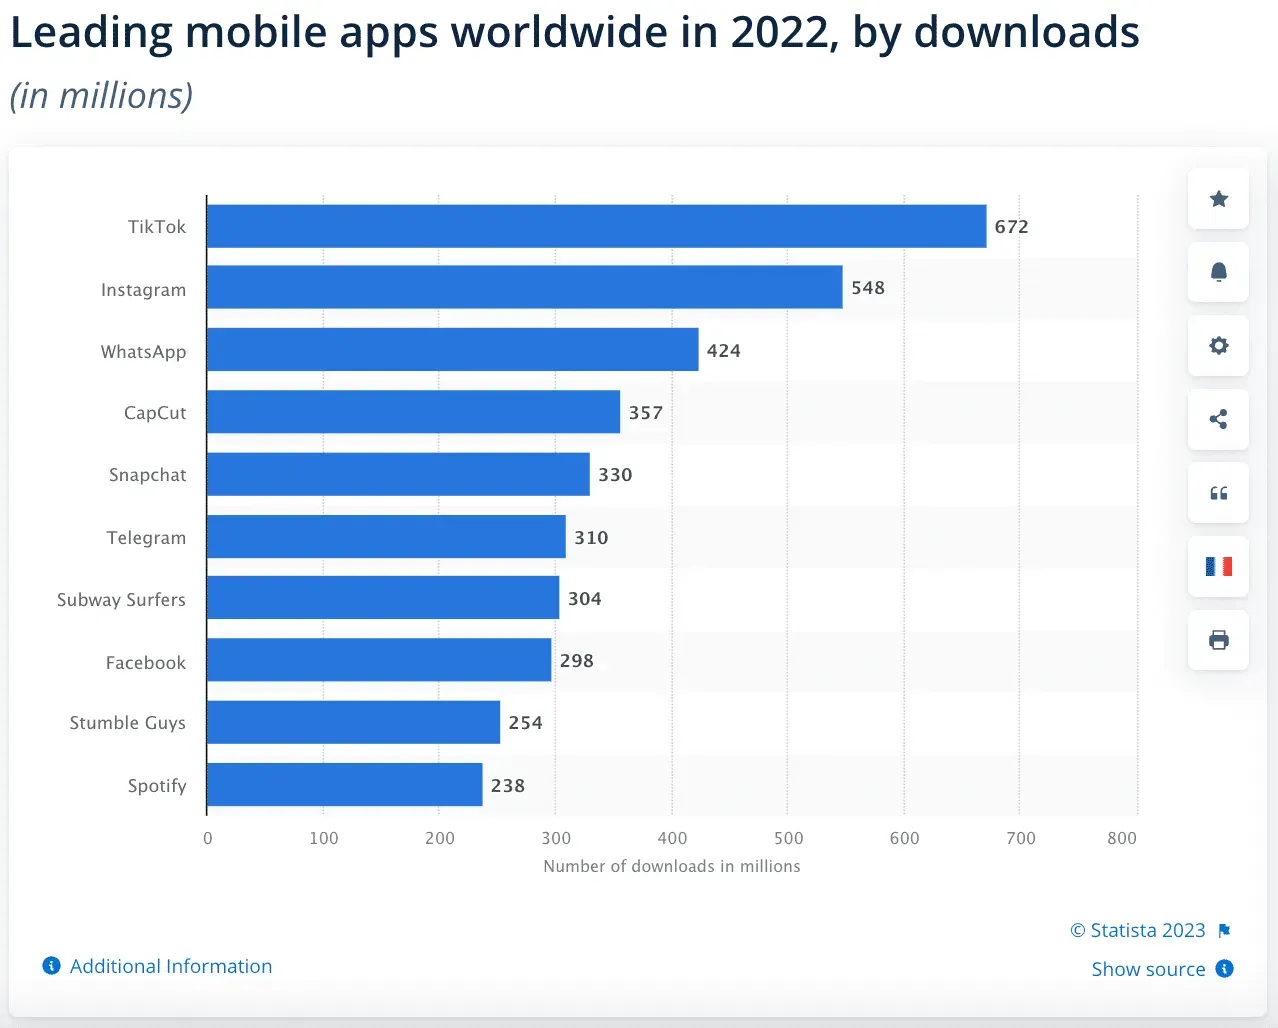
- In 2022, TikTok was the most downloaded mobile app in the world with 672 million downloads.
Source: Statistics
- By 2024, the number of TikTok users in the US is expected to rise to just over 100 million.
- TikTok ads reach 18.6% of total internet users worldwide.
Demography
- In the US, more than half of people aged 18-29 use TikTok.
- People between the ages of 18 and 34 make up the majority of TikTok users in the US.
- 61% of TikTok users identify as women
- People aged 12 to 24 make up 41.6%, or almost half, of TikTok users in the US.
Application
- TikTok users worldwide spend an average of 22.9 hours per month on the app.
- The video sharing app is ranked 6th in the list of the most popular social networks in the world.
- 81% of TikTok users also use Instagram
- The main reason people use TikTok is to find funny or entertaining content.
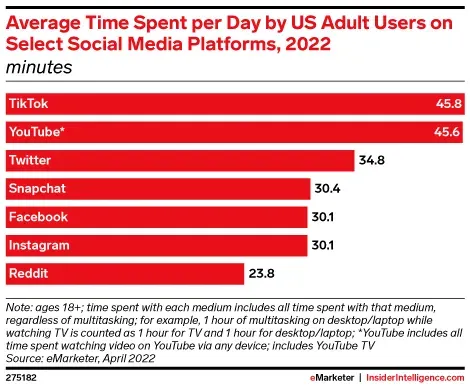
- The average US user spends almost 46 minutes per day on TikTok, about as much as YouTube.
Source: Insider Intelligence.
Brands
- The most followed TikTok account is Khabane Lame (@khaby.lame), who has over 154 million followers.
- The brand’s most popular account is its own TikTok channel with 67 million subscribers.
- 63% of the highest CTR TikTok ads share their message within the first 3 seconds.
- Vertical videos shot on TikTok have 25% more views.
Do your TikTok fit the bill? Boost your TikTok knowledge with 23 essential TikTok statistics marketers need to know in 2023.
Twitter statistics
Users
- Twitter has 238 million daily active users
- Users spend an average of 5.1 hours per month on Twitter.
- Twitter is more popular among Millennials than Generation Z
- US Twitter users are more Democrats than Republicans
- 23% of US adults use Twitter
- Twitter is the seventh most popular social network in the world
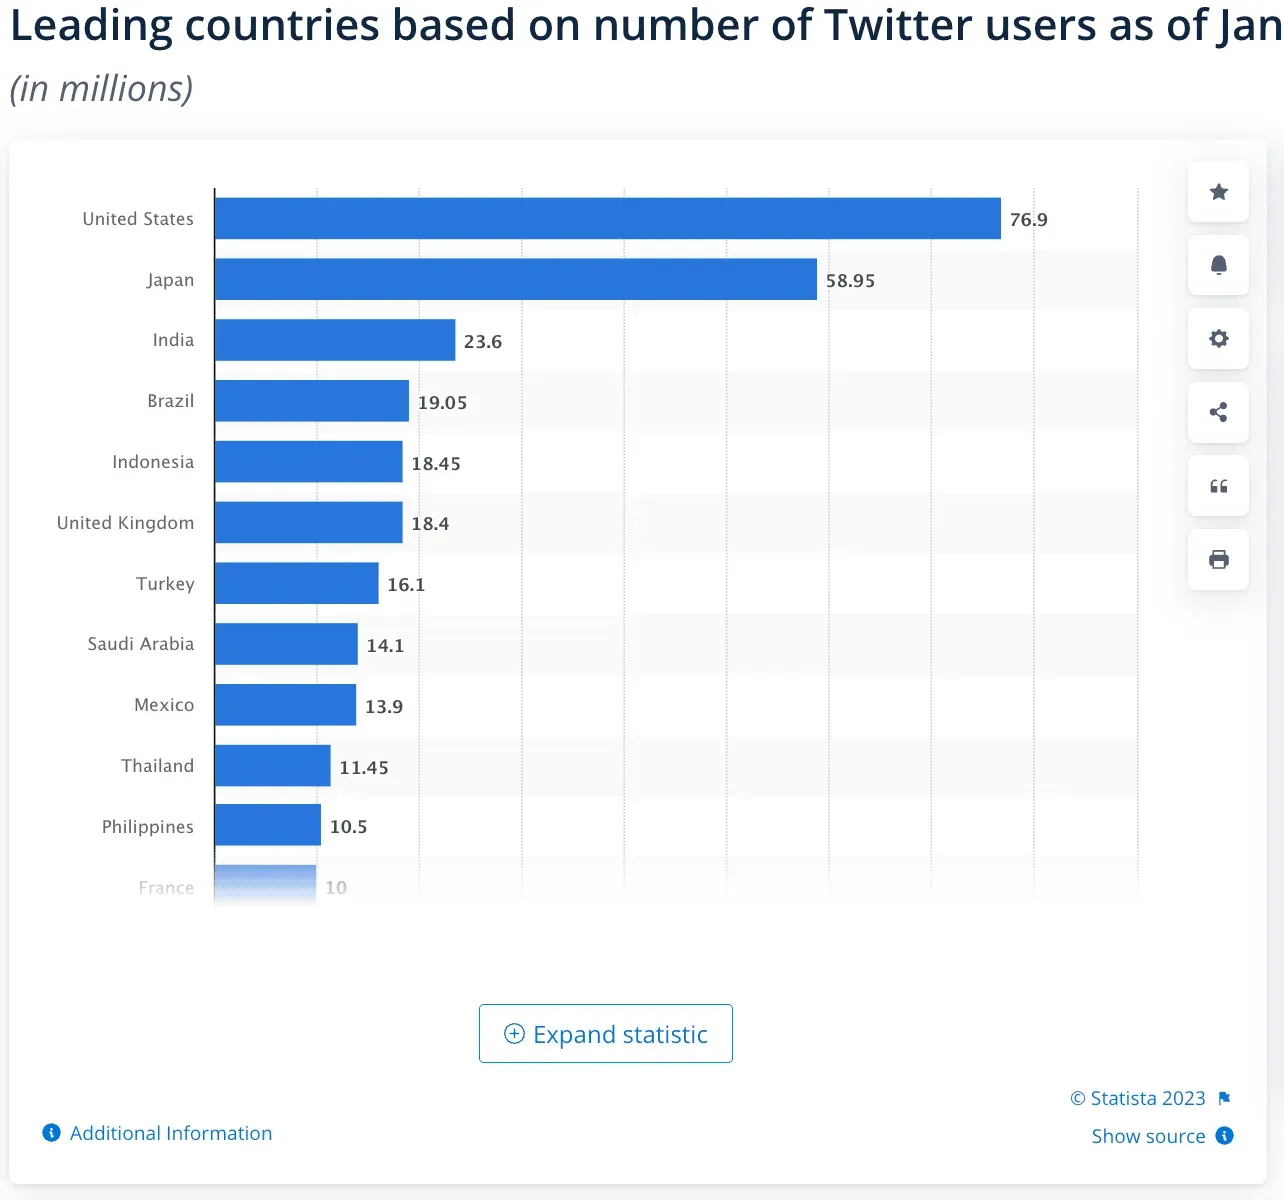
- The app is most commonly used in the United States, followed by Japan.
Source: Statistics
Demography
- 38.5% of Twitter users are between the ages of 25 and 34.
- Only 6.6% of Twitter users are between the ages of 13 and 17.
- Globally, Twitter’s audience is more male-biased, with 56.4% of the platform’s demographic users identifying as male. 43.6% of Twitter audiences identify as women
- 33% of Americans who use Twitter have a college degree.
Application
- People spend over 5 hours per month browsing Twitter
- The main reason Twitter users are on the app is to keep up to date with news and current events.
- 87% of Twitter users also use Instagram
- Adults spend an average of 31 minutes a day on Twitter.
- In 2024, the number of Twitter users worldwide is expected to decline by 5.1%.

Source: Insider Intelligence.
Brands
- More than 15% of Internet users aged 16 to 64 use microblogging to research brands.
- Twitter ads could reach over 544 million users worldwide
- 9% of web traffic referrals come from Twitter.
Follow this link to see even more Twitter stats.
YouTube statistics
Users
- Of all social media channels, people spend the most time on YouTube.
- YouTube boasts an average of 23.4 hours per month spent on the video platform, the most of any social platform.
- 81% of Americans use YouTube
- 36% of American adults access YouTube multiple times a day.
- Globally, 47.5% of YouTube users also use TikTok.
Demography
- 80% of parents say their kids (under 11) watch YouTube
- 54% of YouTube users are men, 46% are women.
- YouTube is most popular in India, followed by the US and Indonesia.
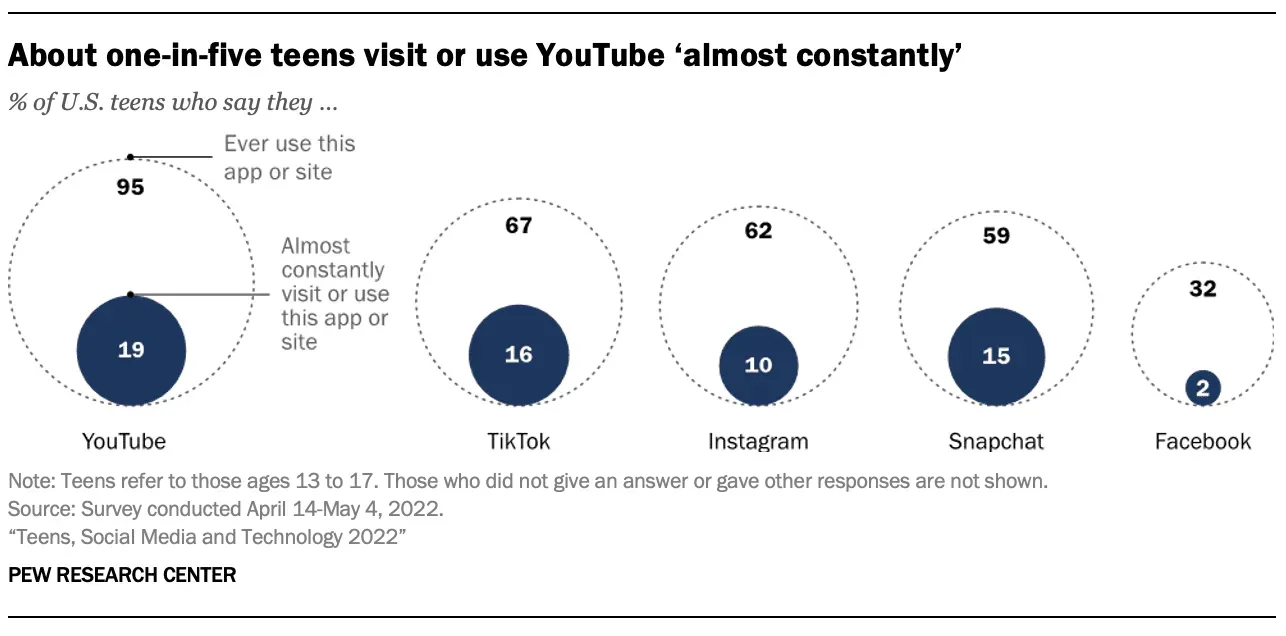
- The video platform is used by 95% of teens in the US, making it the most popular social media platform among Generation Z.
Source: Pew Research Center.
Application
- YouTube is the second most visited site in the world after Google
- The website generates over 66 billion visits per month.
- People spend an average of 23.4 hours on YouTube per month.
- YouTube is the second most popular social network in the world
- Visitors spend an average of 29 minutes 37 seconds per visit to YouTube.
- In 2022, over 500 hours of video were uploaded to YouTube every minute per day.
- Mobile users visit twice as many YouTube pages as desktop users.
- By 2025, the number of sports viewers on YouTube is expected to reach 90 million.
- Shorts on YouTube have already been viewed more than 5 trillion times.
- 59% of Gen Z users say they use short video apps to find content they then watch in longer versions.
Brands
- The most searched term on YouTube is “song”, followed by “movie”and “video”.
- 68% of users watched YouTube to make a purchasing decision.
- 13.8% of internet users aged 16-64 use video for brand research.
- Vertical creative assets drive 10-20% more conversions per dollar on YouTube Shorts than landscape assets alone.
- YouTube ads can reach 2.51 billion users.
Need more YouTube stats in your life? Take a look at 23 YouTube stats that matter to marketers in 2023.
Linkedin stats
Users
- LinkedIn is used by over 875 million people worldwide.
- 28% of US adults are on LinkedIn.
Demography
- More than 194 million Americans use LinkedIn, making the country the highest user count in the world.
- Finland has one of the lowest levels of LinkedIn usage, with only 1 million people on the platform.
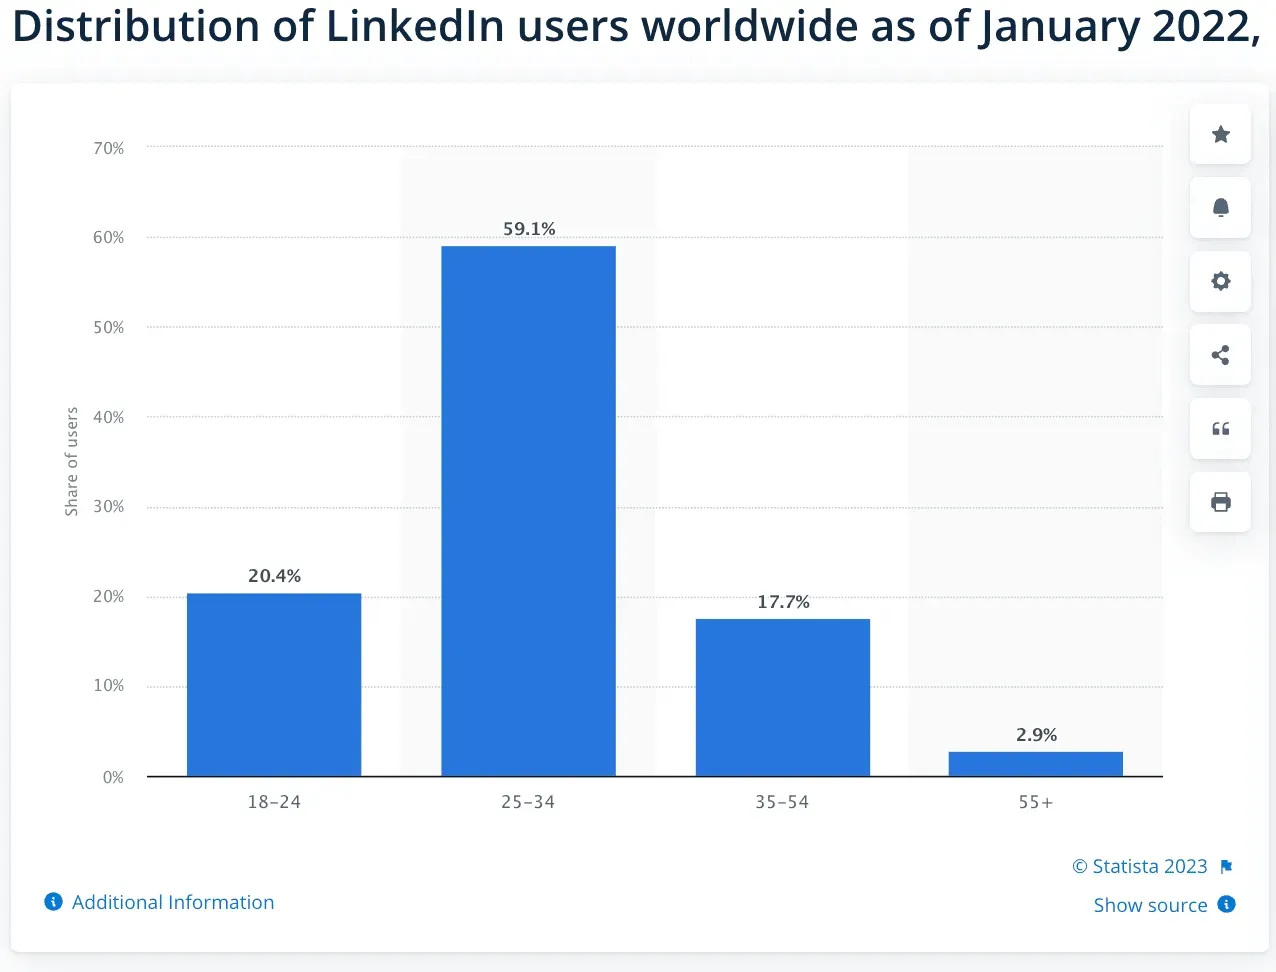
- Nearly 60% of LinkedIn users are between the ages of 25 and 34, while users over 55 make up only 2.9% of the platform’s audience.
Source: Statistics
Application
- There are 101 job applications on LinkedIn every second.
- Every week, 52 million people use LinkedIn to find work.
- Globally, 66% of LinkedIn users also use Twitter.
- 29% of LinkedIn users worldwide say they use the platform to keep up with current events.
- Just over 16% of LinkedIn users log in daily through the app, while 48.5% log in monthly.
- 8 people are hired on LinkedIn every minute
Brands
- The most popular brands on LinkedIn include Amazon, Google, TED Conferences, Microsoft, Unilever, and Forbes.
- LinkedIn boasts over 58 million businesses listed on the site.
- By the end of 2022, LinkedIn’s revenue grew by 17%.
- The network site has expanded into content and currently has 150 million newsletter subscriptions on LinkedIn.
- LinkedIn ads reach 857 million people, which is just over 10% of the world’s population.
- Ads on LinkedIn reach 43.8% of women and 56.2% of men.
If you want even juicier LinkedIn stats, read the LinkedIn stats marketers need to know.
pinterest stats
Users
- 445 million people use Pinterest every month.
- 86 million people in the US use Pinterest monthly
- 31% of Americans use Pinterest
Demography
- Generation Z and male Pinterest users increased 40% year-on-year.
- Women make up 60% of the global Pinterest audience.
- 45% of people in the US who earn over $100,000 per household use Pinterest.
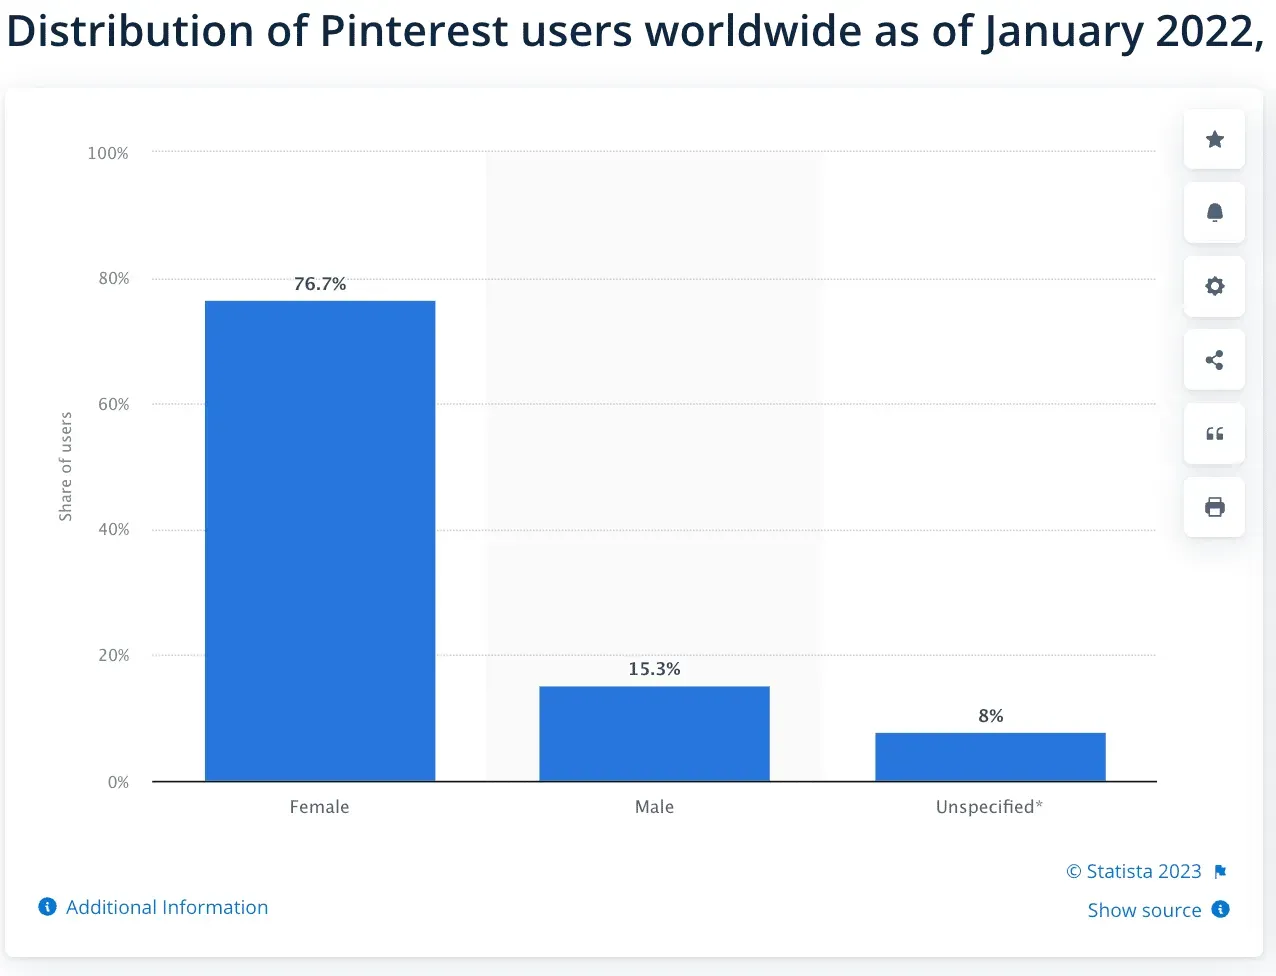
- 76.7% of Pinterest users are women, 15.3% are men, 8% did not specify
Source: Statistics
Application
- 86% of Pinterest users also use Instagram, which is not surprising given the visual nature of both channels.
- 97% of the top searches on Pinterest are not branded (meaning users haven’t made a decision yet and/or are looking for inspiration or ideas)
- 8 out of 10 people associate Pinterest with positive emotions
- The main reason people use Pinterest is to follow or research brands and products.
- 6.52% of web traffic referrals come from Pinterest.
Brands
- Nearly 10.4% of Internet users aged 16 to 64 use online message boards to research brands.
- Pinterest ads reach over 270 million people.
- Women aged 25 to 34 make up a third of Pinterest’s advertising audience.
- 80% of weekly users discover a new brand or product on Pinterest.
- 80% of Pinterest Predicts trends come true every year
Take a look at more amazing Pinterest stats in our Pinterest stats that matter to marketers blog.
snapchat stats
Users
- Snapchat boasts 363 million daily active users
- DAU annual growth in 2022 was 19%.
- 25% of American adults use Snapchat (ahead of Twitter and TikTok).
Demography
- Globally, Snapchat reaches 75% of the Gen Z population and millennials.
- The social media app is most popular with both men and women aged 18-24, while the least popular group are men aged 50+.

Source: Hootsuite 2022 Digital Trends Report
Application
- On average, users spend just over 3 hours a month on Snapchat.
- Surprisingly, Snapchat is the only channel that doesn’t exclusively contain its user base, which means that the Snapchat audience also browses other channels.
- 59% of Snapchat users visit the app daily
- In 2022, the average daily time that users aged 35 and over spend watching shows and publisher content increased by more than 40% compared to last year.
Brands
- Snapchat’s revenue increased to $4.4 billion in 2022.
- In 2022, the time spent watching Snapchat Spotlight content increased by 55% compared to last year.
- Snapchat users are 34% more likely to make a purchase after seeing ads on the platform.
- The Snapchat+ subscription service reached over 1.5 million paid subscribers in the third quarter of 2022.
- The total potential advertising audience of Snapchat around the world is more than 575 million people.
- Snapchatters owns 4.4 trillion in purchasing power
Want more Snapchat stats in your life? Next, read the Snapchat stats that matter to social media marketers.
Leave a Reply